This is the multi-page printable view of this section. Click here to print.
Documentation
- 1: Introduction
- 2: Getting Started
- 2.1: Installation
- 2.2: Quick Start
- 2.2.1: IHPA (Intelligent HPA)
- 2.2.1.1: Cron Scaling
- 2.2.1.2: Reactive Scaling
- 2.2.1.3: Predictive Scaling
- 2.2.1.4: Multi-Stage Gray Scaling
- 3: User Guide
- 3.1: IHPA (Intelligent HPA)
- 3.1.1: Concepts
- 3.1.1.1: IHPA Architecture Overview
- 3.1.1.2: Principles of Predictive Scaling
- 3.2: Algorithm
- 3.3: Use Custom Metrics
- 3.4: FAQ
- 4: Contributing
- 4.1: Developer Guide
- 5: Roadmap
1 - Introduction
Kapacity is an open cloud native capacity solution which helps you achieve ultimate resource utilization in an intelligent and risk-free way.
It automates your scaling, mitigates capacity risks, saves your effort as well as cost.
Kapacity is built upon core ideas and years of experience of the large-scale production capacity system at Ant Group, which saves ~100k cores yearly with high stability and zero downtime, combined with best practices from the cloud native community.
Watch our talk (in Chinese) at KubeCon China 2023 “How We Build Production-Grade HPA: From Effective Algorithm to Risk-Free Autoscaling” to learn the core idea and principles of Kapacity’s Intelligent HPA in depth!
Core Features
Intelligent HPA
Kubernetes HPA is a common way used to scale cloud native workloads automatically, but it has some BIG limitations listed below which make it less effective and practical in real world large-scale production use:
- HPA works in a reactive way, which means it would only work AFTER the target metrics exceeding the expected value. It can hardly provide rapid and graceful response to traffic peaks, especially for applications with longer startup times.
- HPA calculates replica count based on metrics by a simple ratio algorithm, with an assumption that the replica count must have a strict linear correlation with related metrics. However, this is not always the case in real world.
- Scaling is a highly risky operation in production, but HPA provides little risk mitigation means other than scaling rate control.
- HPA is a Kubernetes built-in, well, this is not a limitation literally, but it does limit some functions/behaviors to specific Kubernetes versions, and there is no way for end users to extend or adjust its functionality for their own needs.
So we build Intelligent HPA (IHPA), an intelligent, risk-defensive, highly adaptive and customizable substitution for HPA. It has following core features:
Intelligent Scaling
Autoscaling is essentially a data-driven decision-making process. IHPA can make use of different algorithms under different scenarios. In addition to simple cron-based replica control and classic reactive ratio algorithms, it also supports a variety of intelligent algorithms such as predictive and burst algorithms, and all these algorithms can be combined to take effect based on custom strategies which enables IHPA to adapt to a wide variety of use cases.
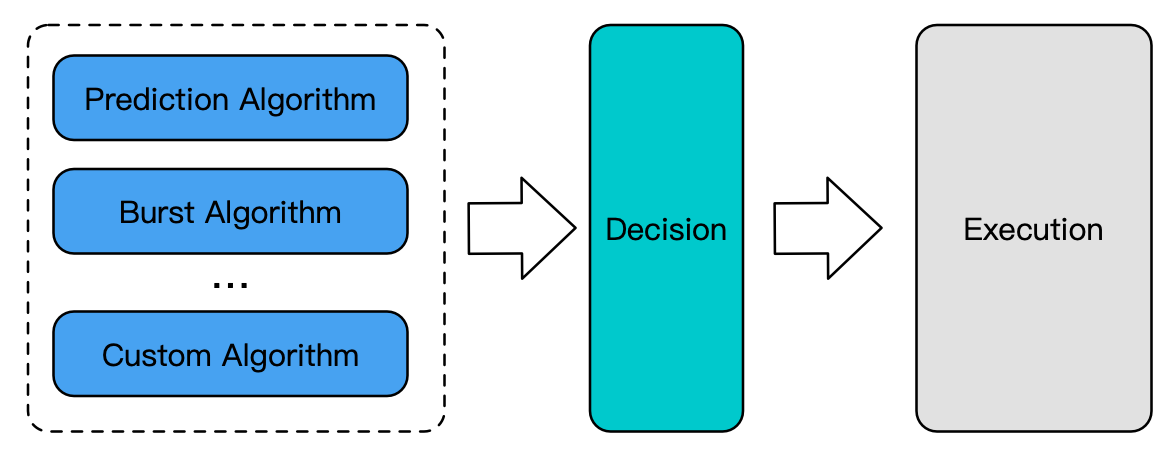
Taking the predictive algorithm as an example, in real world production, the resource utilization of an application is usually affected by multiple external traffics, or even its own tasks, machine performance, etc., and the relationship between replicas and resource utilization might not be linear. This presents a great challenge to replicas prediction.
To solve this problem, IHPA introduces a set of predictive algorithms based on machine learning that Ant Group has adopt to its internal large-scale production workloads. It first does time series prediction (making use of Swish Net for Time Series Forecasting, which is optimized for traffic forcasting) for each application traffic, and then uses the Linear-Residual Model to build a comprehensive relationship between traffics, resource utilization and replicas, and finally makes use of the relationship and traffic predictions to infer the recommended future replicas for the application.
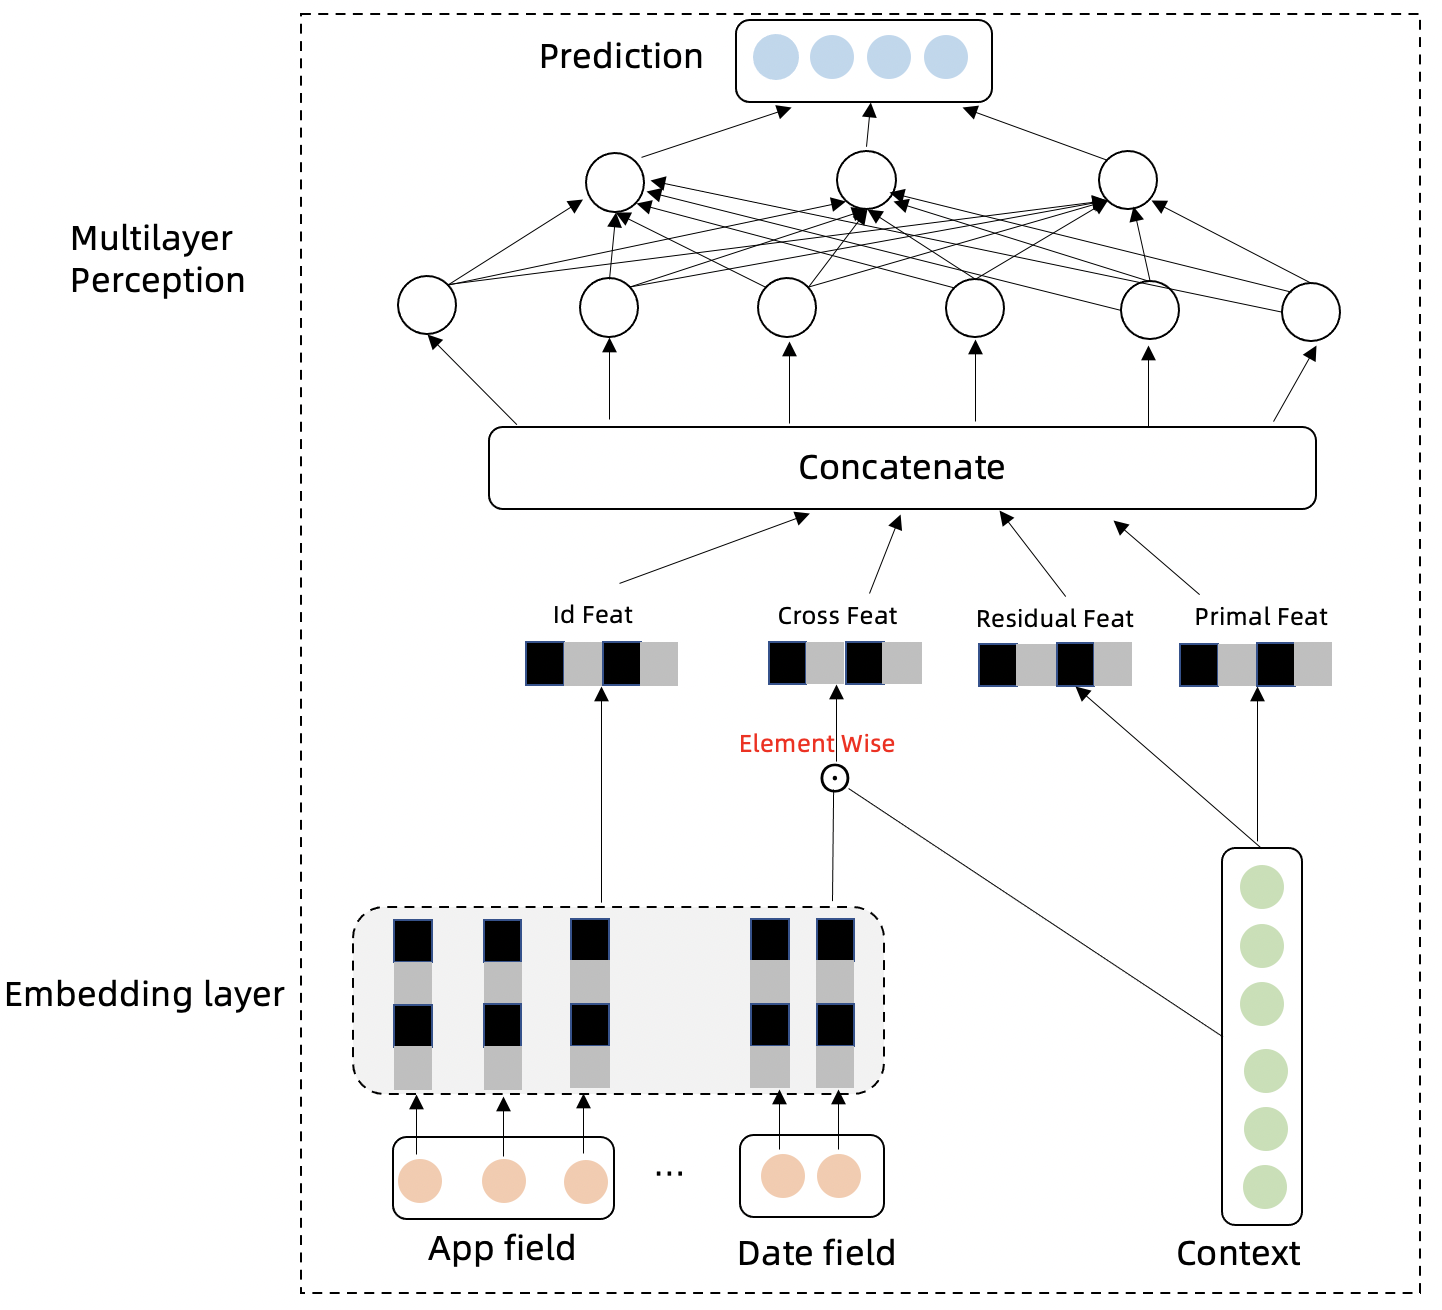
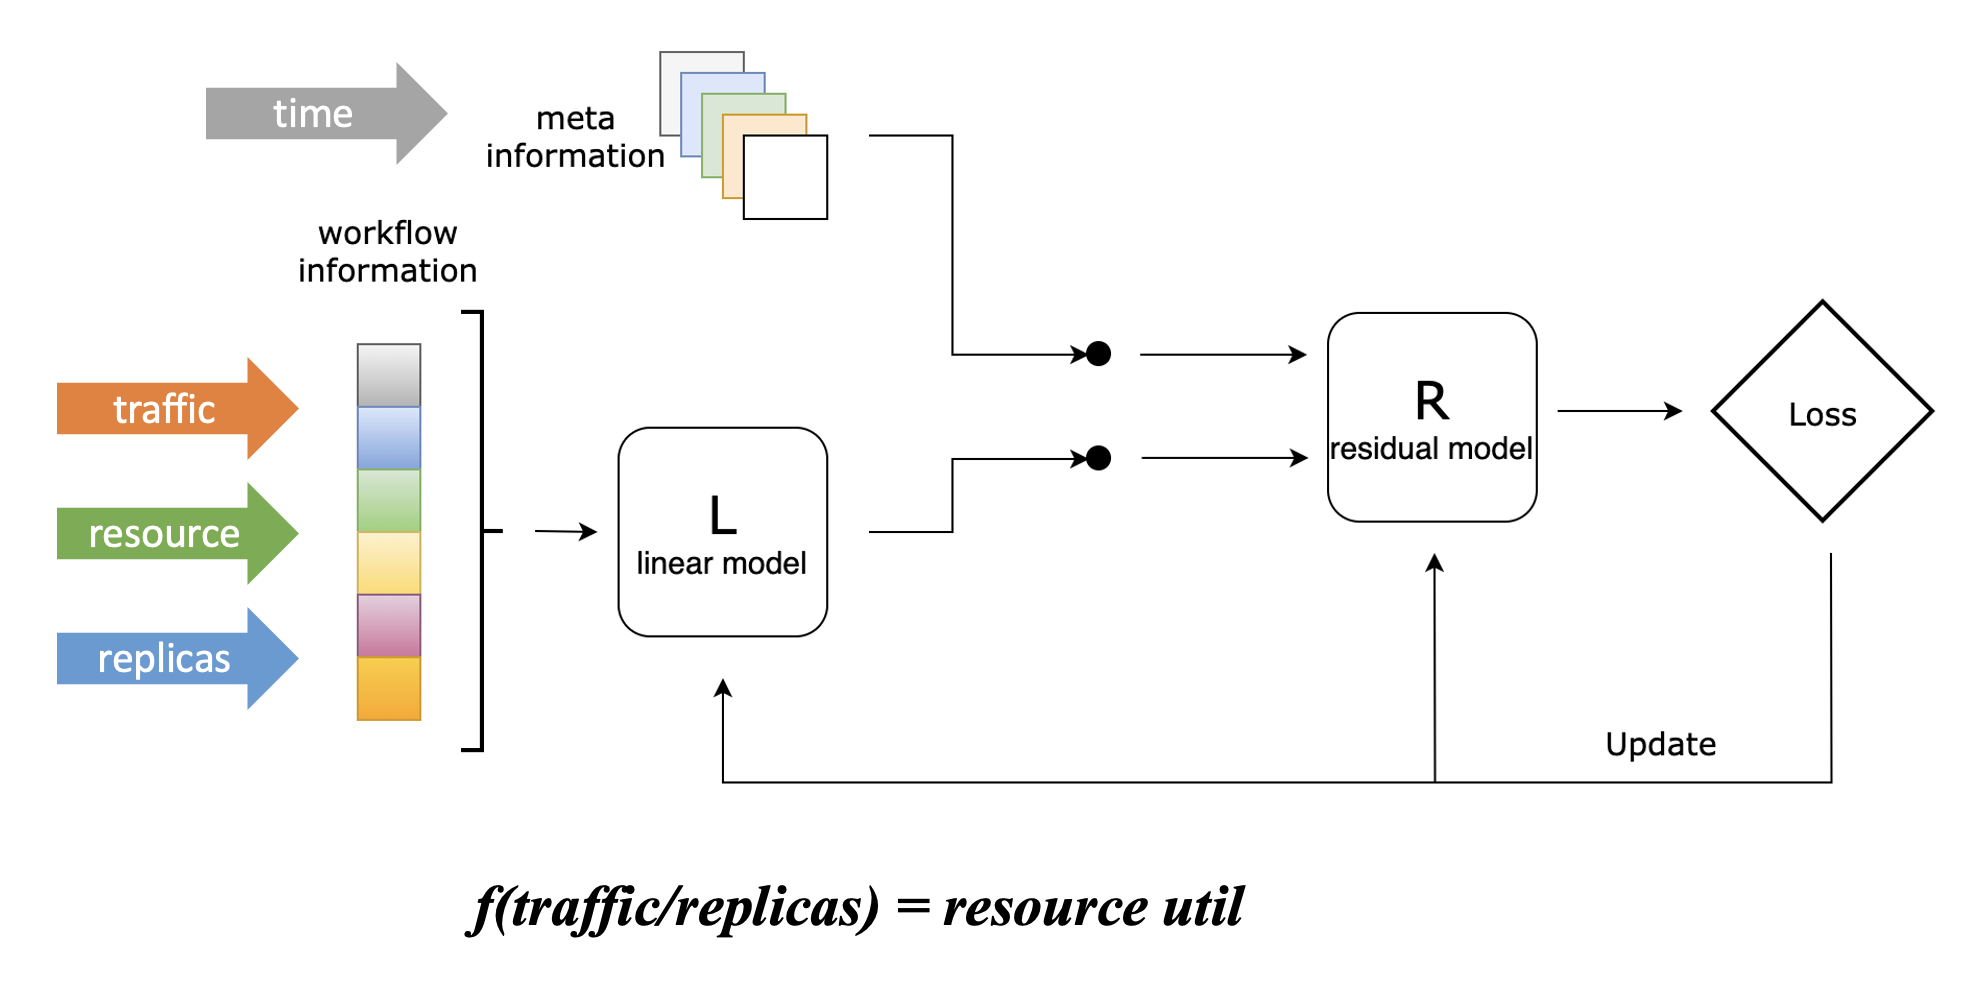
Through the core “traffic-driven” idea, this algorithm is suitable for a variety of complex scenarios in real-world production such as multi period and trending traffic, load affected by multiple traffics, non-linear correlation between load and replica count, and so on.
Multi-Stage Scaling
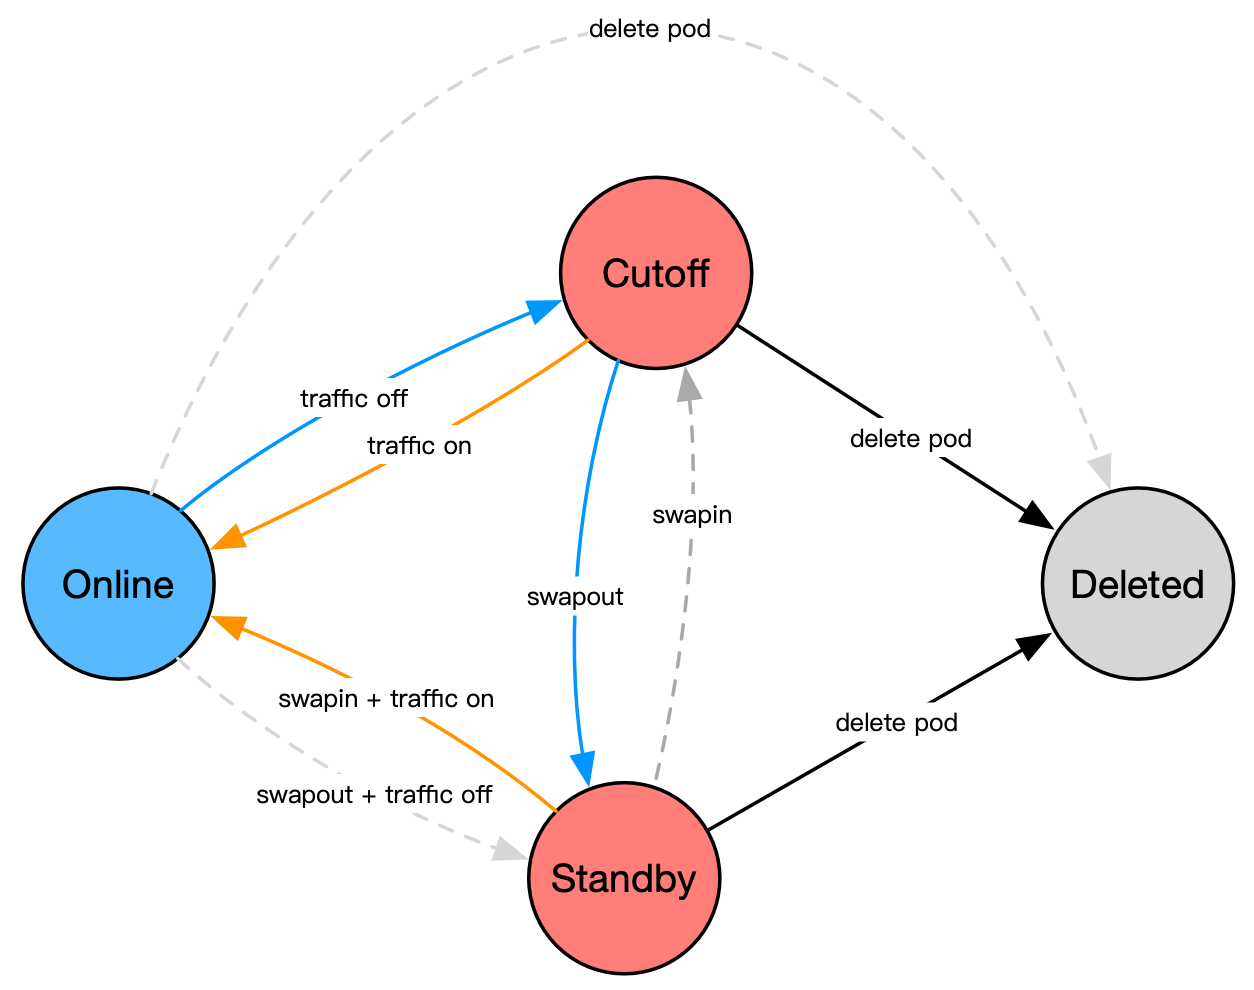
Unlike Kubernetes HPA which only supports simply scaling workloads up and down, IHPA supports fine-grained control of the state of each Pod under the workload throughout the scaling process, which improves the scaling efficiency as well as mitigates scaling risks.
Kapacity defines the following Pod states currently:
- Online: The Pod is serving traffics normally (Running and Ready). It is also the default state of every newly created Pod.
- Cutoff: The Pod is running but not serving traffics (Running but Not Ready). In practice, IHPA supports scaling down Pod to this state with additional stability observation time, and once a risk is detected, the Pod can be rolled back to the Online state in seconds.
- Standby: The Pod’s resources are swapped out and kept at a low usage level. Compared with the Cutoff state, this state can actually release the resources of the Pod for reuse, and also supports rolling back to the Online state in minutes.
- Deleted: The Pod has been deleted. In fact, the Pod itself would not exist in this state.
High Stability
IHPA is built upon years of experience of autoscaling practice for large-scale production workloads at Ant Group, which leads to many unique abilities to guarantee high stability during autoscaling.
Gray Scaling
IHPA supports fully customizable gray change for both scale up and scale down, and it can even be combined with the pod state control mechanism to achieve multi-stage gray change.
The following example shows the process of a multi-stage gray scaling: At first, the workload has 6 Pods, and IHPA wants to scale it down to 2 Pods. Then IHPA would change the Pods’ state in batch according to user’s configurations. Users (or IHPA itself, introduced in next section) can do stability observation between each change. In addition, there would be an additional observation period at the end of gray change. If everything work smoothly, the Pods would be actually scaled down at the end of the observation period. Or if any risk is detected, the Pods can be rolled back to the Online state very quickly.

Automatic Risk Detection and Mitigation
Sometimes it is not easy to detect risks only by monitoring the metrics used for scaling during autoscaling. Therefore, IHPA supports automatic risk mitigation based on customizable stability checks. You can let it monitor arbitrary metrics (not limited to the metrics which drive autoscaling) for risk detection, or even define your own detection logic, and it can automatically take actions such as suspend or rollback the scaling to mitigate risks, which achieves a fully automated autoscaling with high stability.
Open and Highly Extensible Architecture
Kapacity is born to be an open project which is easy to integrate or extend. For IHPA as an example:
- IHPA is split into three independent modules for replica count calculation, workload replicas control and overall autoscaling process management. Each module is replaceable and extensible.
- Various extension points are exposed which makes the behavior of IHPA fully customizable and extensible. For example, you can customize how to control traffics of the pod, which pods shall be scaled down first, how to detect risks during autoscaling and so on.
2 - Getting Started
2.1 - Installation
Prerequisites
- Kubernetes 1.16+ (1.22+ recommended)
- Helm 3
Install
Install cert-manager
Install cert-manager by Helm.
helm repo add jetstack https://charts.jetstack.io
helm repo update

helm install \
  cert-manager jetstack/cert-manager \
  --namespace cert-manager \
  --create-namespace \
  --set installCRDs=true
Install Prometheus
Install Prometheus with kube-state-metrics by Helm.
helm repo add prometheus-community https://prometheus-community.github.io/helm-charts
helm repo update

helm install \
  prometheus prometheus-community/prometheus \
  --namespace prometheus \
  --create-namespace \
  --set alertmanager.enabled=false \
  --set prometheus-node-exporter.enabled=false \
  --set prometheus-pushgateway.enabled=false
Run following command to view Prometheus Server’s ClusterIP and port:
kubectl get svc -n prometheus prometheus-server
NAME                TYPE        CLUSTER-IP      EXTERNAL-IP   PORT(S)   AGE
prometheus-server   ClusterIP   10.104.214.48   <none>        80/TCP    5m
Install Kapacity
Install Kapacity by Helm. The Prometheus Server address params are those got in previous step.
helm repo add kapacity https://traas-stack.github.io/kapacity-charts
helm repo update

helm install \
  kapacity-manager kapacity/kapacity-manager \
  --namespace kapacity-system \
  --create-namespace \
  --set prometheus.address=http://<prometheus-server-clusterip>:<prometheus-server-port>
Verify Kapacity installation
kubectl get deploy -n kapacity-system
NAME               READY   UP-TO-DATE   AVAILABLE   AGE
kapacity-manager   1/1     1            1           5m
Uninstall
helm uninstall kapacity-manager -n kapacity-system
helm uninstall prometheus -n prometheus
helm uninstall cert-manager -n cert-manager
2.2 - Quick Start
2.2.1 - IHPA (Intelligent HPA)
IHPA (Intelligent HPA) is an intelligent, risk-defensive, highly adaptive and customizable substitution for HPA.
You can follow below guides to quickly try some core features of IHPA.
2.2.1.1 - Cron Scaling
Before you begin
You need to have a Kubernetes cluster with Kapacity installed.
Run sample workload
Download nginx-statefulset.yaml and run following command to run an NGINX workload:
kubectl apply -f nginx-statefulset.yaml
Check if the workload is running:
kubectl get po
NAME      READY   STATUS    RESTARTS   AGE
nginx-0   1/1     Running   0          5s
Create IHPA with cron portrait provider
Download cron-portrait-sample.yaml which looks like this:
apiVersion: autoscaling.kapacitystack.io/v1alpha1
kind: IntelligentHorizontalPodAutoscaler
metadata:
  name: cron-portrait-sample
spec:
  scaleTargetRef:
    apiVersion: apps/v1
    kind: StatefulSet
    name: nginx
  minReplicas: 1
  maxReplicas: 10
  portraitProviders:
  - type: Cron
    priority: 1
    cron:
      crons:
      - name: cron-1
        start: 0 * * * *
        end: 10 * * * *
        replicas: 1
      - name: cron-2
        start: 10 * * * *
        end: 20 * * * *
        replicas: 2
      - name: cron-3
        start: 20 * * * *
        end: 30 * * * *
        replicas: 3
      - name: cron-4
        start: 30 * * * *
        end: 40 * * * *
        replicas: 4
      - name: cron-5
        start: 40 * * * *
        end: 50 * * * *
        replicas: 5
Run following command to create the IHPA:
kubectl apply -f cron-portrait-sample.yaml
Verify results
You can see that the replica number of the workload is changing dynamically accroding to our configration by checking the events of the IHPA:
kubectl describe ihpa cron-portrait-sample
...
Events:
  Type     Reason                Age                From             Message
  ----     ------                ----               ----             -------
  Normal   CreateReplicaProfile  38m                ihpa_controller  create ReplicaProfile with onlineReplcas: 3, cutoffReplicas: 0, standbyReplicas: 0
  Normal   UpdateReplicaProfile  33m (x2 over 33m)  ihpa_controller  update ReplicaProfile with onlineReplcas: 3 -> 4, cutoffReplicas: 0 -> 0, standbyReplicas: 0 -> 0
  Normal   UpdateReplicaProfile  23m                ihpa_controller  update ReplicaProfile with onlineReplcas: 4 -> 5, cutoffReplicas: 0 -> 0, standbyReplicas: 0 -> 0
  Warning  NoValidPortraitValue  13m                ihpa_controller  no valid portrait value for now
  Normal   UpdateReplicaProfile  3m15s              ihpa_controller  update ReplicaProfile with onlineReplcas: 5 -> 1, cutoffReplicas: 0 -> 0, standbyReplicas: 0 -> 0
You can also verify it by directly watching the replica number of the workload.
Note
You can see aNoValidPortraitValue event because the cron expressions configured do not cover this period of time, and the replica number of the workload will remain unchanged at this time.
Cleanup
Run following command to cleanup all the resources:
kubectl delete -f cron-portrait-sample.yaml
kubectl delete -f nginx-statefulset.yaml
2.2.1.2 - Reactive Scaling
Before you begin
You need to have a Kubernetes cluster with Kapacity and Prometheus installed.
Run sample workload
Download nginx-statefulset.yaml and run following command to run an NGINX workload:
kubectl apply -f nginx-statefulset.yaml
Check if the workload is running:
kubectl get po
NAME      READY   STATUS    RESTARTS   AGE
nginx-0   1/1     Running   0          5s
Create IHPA with dynamic reactive portrait provider
Download dynamic-reactive-portrait-sample.yaml which looks like this:
apiVersion: autoscaling.kapacitystack.io/v1alpha1
kind: IntelligentHorizontalPodAutoscaler
metadata:
  name: dynamic-reactive-portrait-sample
spec:
  scaleTargetRef:
    apiVersion: apps/v1
    kind: StatefulSet
    name: nginx
  minReplicas: 1
  maxReplicas: 10
  portraitProviders:
  - type: Dynamic
    priority: 1
    dynamic:
      portraitType: Reactive
      metrics:
      - type: Resource
        resource:
          name: cpu
          target:
            type: Utilization
            averageUtilization: 30
      algorithm:
        type: KubeHPA
Run following command to create the IHPA:
kubectl apply -f dynamic-reactive-portrait-sample.yaml
Increase the load
Run following command to get the ClusterIP and port of the NGINX service:
kubectl get svc nginx
NAME         TYPE        CLUSTER-IP     EXTERNAL-IP   PORT(S)    AGE
nginx        ClusterIP   10.111.21.74   <none>        80/TCP     13m
Start a different pod to act as a client which will send requests to the NGINX service infinitely with the service ip and port replaced by the value got in previous step:
# Run this in a separate terminal so that the load generation continues and you can carry on with the rest of the steps
kubectl run -i --tty load-generator --rm --image=busybox --restart=Never -- /bin/sh -c "while sleep 0.01; do wget -q -O- http://<service-ip>:<service-port> > /dev/null; done"
After several minutes, you can see that the workload is scaled up by checking events of the IHPA:
kubectl describe ihpa dynamic-reactive-portrait-sample
...
Events:
  Type    Reason                Age    From             Message
  ----    ------                ----   ----             -------
  Normal  CreateReplicaProfile  6m58s  ihpa_controller  create ReplicaProfile with onlineReplcas: 1, cutoffReplicas: 0, standbyReplicas: 0
  Normal  UpdateReplicaProfile  3m45s  ihpa_controller  update ReplicaProfile with onlineReplcas: 1 -> 6, cutoffReplicas: 0 -> 0, standbyReplicas: 0 -> 0
Stop generating load
In the terminal where you created the Pod that runs a busybox image, terminate the load generation by typing <Ctrl> + C.
After several minutes, you can see that the workload is scaled down by checking events of the IHPA:
kubectl describe ihpa dynamic-reactive-portrait-sample
...
Events:
  Type    Reason                Age    From             Message
  ----    ------                ----   ----             -------
  Normal  CreateReplicaProfile  9m58s  ihpa_controller  create ReplicaProfile with onlineReplcas: 1, cutoffReplicas: 0, standbyReplicas: 0
  Normal  UpdateReplicaProfile  6m45s  ihpa_controller  update ReplicaProfile with onlineReplcas: 1 -> 6, cutoffReplicas: 0 -> 0, standbyReplicas: 0 -> 0
  Normal  UpdateReplicaProfile  3m15s  ihpa_controller  update ReplicaProfile with onlineReplcas: 6 -> 4, cutoffReplicas: 0 -> 0, standbyReplicas: 0 -> 0
  Normal  UpdateReplicaProfile  2m45s  ihpa_controller  update ReplicaProfile with onlineReplcas: 4 -> 1, cutoffReplicas: 0 -> 0, standbyReplicas: 0 -> 0
Cleanup
Run following command to cleanup all the resources:
kubectl delete -f dynamic-reactive-portrait-sample.yaml
kubectl delete -f nginx-statefulset.yaml
2.2.1.3 - Predictive Scaling
Note: Most contents of this page are translated by AI from Chinese. It would be very appreciated if you could help us improve by editing this page (click the corresponding link on the right side).
Before you begin
You need to have a Kubernetes cluster with Kapacity and Prometheus installed.
Make sure your Kubernetes cluster has a working DNS (like CoreDNS) to resolve Service domain names. If not, you need to adjust the configuration of Kapacity as follows:
Use the following command to view the ClusterIP and port of the Kapacity gRPC Server:
kubectl get svc -n kapacity-system kapacity-grpc-service
NAME                    TYPE        CLUSTER-IP       EXTERNAL-IP   PORT(S)    AGE
kapacity-grpc-service   ClusterIP   192.168.38.172   <none>        9090/TCP   5m
Use the following command to update the configuration of Kapacity, where the parameters related to the Kapacity gRPC Server address are the values viewed in the previous step:
helm upgrade \
  kapacity-manager kapacity/kapacity-manager \
  --namespace kapacity-system \
  --reuse-values \
  --set algorithmJob.defaultMetricsServerAddr=<kapacity-grpc-server-clusterip>:<kapacity-grpc-server-port>
Install and configure Ingress NGINX Controller
Kapacity IHPA’s predictive scaling uses the “Traffic-Driven Replicas Prediction” algorithm, so we need at least one traffic metric to use predictive scaling. Here we use Ingress NGINX as an example of workload ingress traffic.
If your Kubernetes cluster does not yet have Ingress NGINX Controller, please refer to the official documentation for installation.
After the installation is complete, follow this document to configure to ensure that Prometheus can collect the metrics of Ingress NGINX.
Configure Kapacity to recognize Ingress NGINX metrics
Use the following command to add the metrics of Ingress NGINX in the custom Prometheus metrics configuration of Kapacity:
kubectl edit cm -n kapacity-system kapacity-config
apiVersion: v1
data:
  prometheus-metrics-config.yaml: |
    resourceRules:
      ...
    # add Ingress NGINX metrics in rules
    rules:
    - seriesQuery: '{__name__="nginx_ingress_controller_requests"}'
      metricsQuery: round(sum(irate(<<.Series>>{<<.LabelMatchers>>}[3m])) by (<<.GroupBy>>), 0.001)
      name:
        as: nginx_ingress_controller_requests_rate
      resources:
        template: <<.Resource>>
        # note: uncomment the overrides field below if your Prometheus is installed with Prometheus Operator
        # overrides:
        #   exported_namespace:
        #     resource: namespace
    externalRules:
      ...
kind: ConfigMap
...
As you can see, this configuration is fully compatible with the Prometheus Adapter configuration, more background information can be found in this user guide.
Then, use the following command to restart Kapacity Manager to load the latest configuration:
kubectl rollout restart -n kapacity-system deploy/kapacity-manager
Notice
Kapacity Manager requires some time to sync the custom metric configuration from Prometheus after startup. If there are many metrics within Prometheus, it might take a considerable amount of time (usually several minutes). You can determine whether the synchronization is complete by checking the standard output logs of the Kapacity Manager Pod for the messagemetrics relisted successfully. Please wait for Kapacity Manager to finish synchronizing the custom metrics before proceeding with subsequent steps.
Run sample workload
- Download nginx-statefulset.yaml and run following command to run an NGINX workload:
kubectl apply -f nginx-statefulset.yaml
Check if the workload is running:
kubectl get po
NAME      READY   STATUS    RESTARTS   AGE
nginx-0   1/1     Running   0          5s
- Download nginx-ingress.yaml and run following command to create an Ingress for the NGINX workload:
kubectl apply -f nginx-ingress.yaml
Verify that Ingress was created successfully and record the ADDRESS of Ingress:
kubectl get ing
NAME           CLASS   HOSTS               ADDRESS           PORTS   AGE
nginx-server   nginx   nginx.example.com   139.224.120.211   80      2d
- Download periodic-client.yaml,replace
<nginx-ingress-address>with the ADDRESS of the Ingress recorded in the previous step, and then execute the following command to create a client Pod that sends requests to the NGINX service on a periodic basis (with 1 hour as 1 cycle):
kubectl apply -f periodic-client.yaml
It will generate periodic traffic as shown in the following figure:
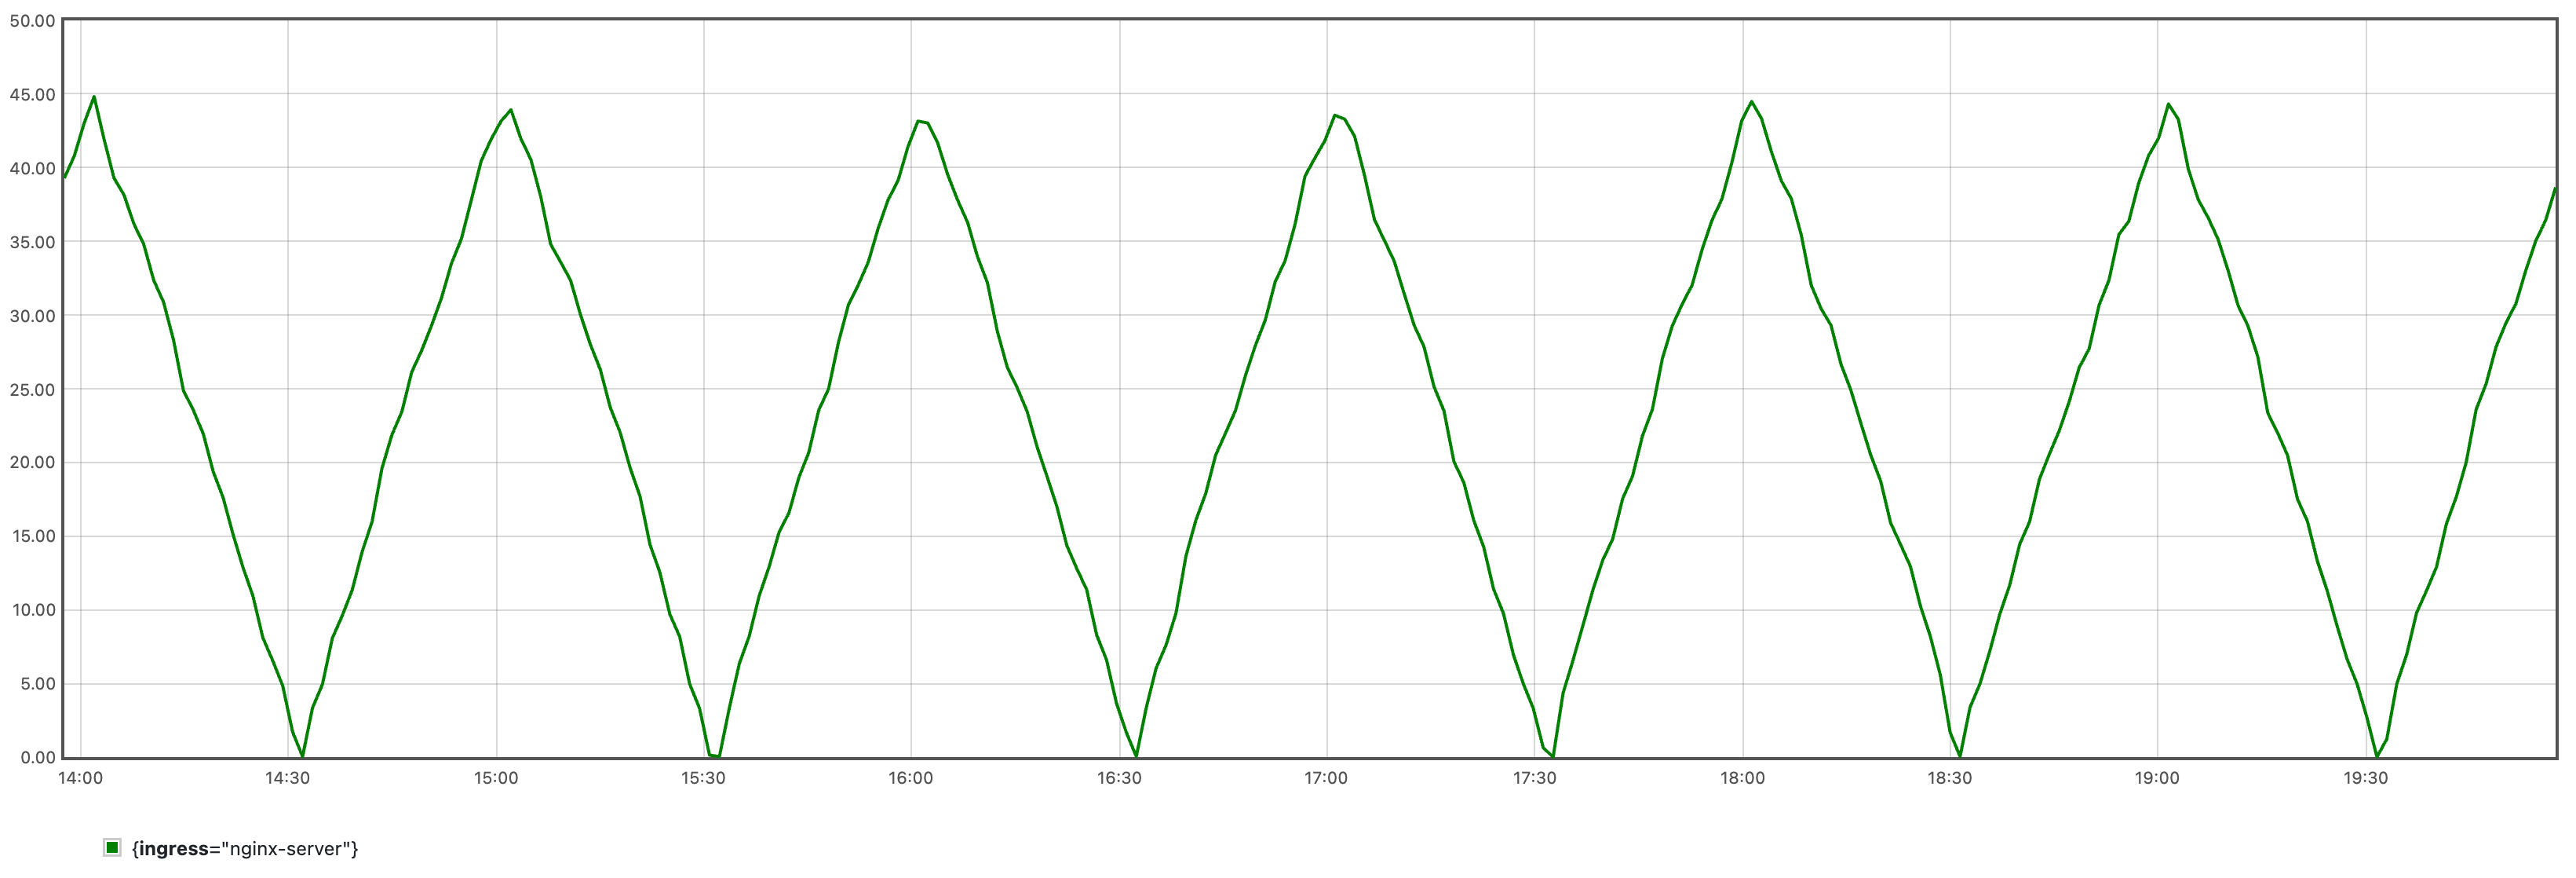
Since the algorithm needs a certain amount of data for learning, it is recommended to run for at least 24 hours before proceeding to the next step.
Train time series forecasting model
Please refer to the user guide to use this configuration to complete the training of the time series prediction model, and then execute the following command to save the model and its accessory files as a ConfigMap for subsequent algorithm tasks to use, replace <model-save-path> with the actual model saving directory path:
kubectl create cm -n kapacity-system example-model --from-file=<model-save-path>
Note
In actual use, we may get a larger model, in this case, we recommend storing model files on persistent volumes rather than a ConfigMap.Create IHPA with dynamic predictive portrait provider
Download dynamic-predictive-portrait-sample.yaml which looks like this:
apiVersion: autoscaling.kapacitystack.io/v1alpha1
kind: IntelligentHorizontalPodAutoscaler
metadata:
  name: predictive-sample
spec:
  scaleTargetRef:
    apiVersion: apps/v1
    kind: StatefulSet
    name: nginx
  minReplicas: 1
  maxReplicas: 10
  portraitProviders:
  - type: Dynamic
    priority: 1
    dynamic:
      portraitType: Predictive
      metrics:
      - type: Resource
        resource:
          name: cpu
          target:
            type: AverageValue
            averageValue: 1m
      - type: Pods
        pods:
          metric:
            name: kube_pod_status_ready
          target:
            type: NA
      - name: qps
        type: Object
        object:
          describedObject:
            apiVersion: networking.k8s.io/v1
            kind: Ingress
            name: nginx-server
          metric:
            name: nginx_ingress_controller_requests_rate
          target:
            type: NA
      algorithm:
        type: ExternalJob
        externalJob:
          job:
            type: CronJob
            cronJob:
              template:
                spec:
                  schedule: "0/30 * * * *"
                  jobTemplate:
                    spec:
                      template:
                        spec:
                          containers:
                          - name: algorithm
                            args:
                            - --tsf-model-path=/opt/kapacity/timeseries/forecasting/model
                            - --re-history-len=24H
                            - --re-time-delta-hours=8
                            - --re-test-dataset-size-in-seconds=3600
                            - --scaling-freq=10min
                            volumeMounts:
                            - name: model
                              mountPath: /opt/kapacity/timeseries/forecasting/model
                              readOnly: true
                          volumes:
                          - name: model
                            configMap:
                              name: example-model
                          restartPolicy: OnFailure
          resultSource:
            type: ConfigMap
Please replace the value of the algorithm parameter --re-time-delta-hours with the UTC offset value of your time zone, such as 8 for UTC+8 time zone, -7 for UTC-7 time zone.
Let’s look at the metrics first. In the “Traffic-driven replica prediction” algorithm, we need multiple types of metrics to jointly drive the algorithm, so we have agreed on the following metric configuration specification:
- The first metric should be configured as the target resource metric of this workload, so the type can only be
ResourceorContainerResource. It specifies the target resource level we expect IHPA to help us maintain. - The second metric should be configured as the online replica count metric of this workload. The algorithm will use this metric to query the historical Ready Pod (i.e., the Pod carrying traffic) count of this workload. The type of this metric can only be
Pods. It will be aggregated on the workload dimension by regular matching of the Pod name for the query. Kapacity defaults to thekube_pod_status_readymetric based on kube-state-metrics for direct use. Note that since this metric is only used for historical query, we do not need to specify a target value for it. Therefore, we write a placeholderNAfor itstargettype. - The third and subsequent metrics should be configured as traffic metrics (such as QPS, RPC, etc.) that are positively correlated with the target resource metric of this workload. The algorithm will perform time series prediction on these metrics, and then based on the historical resource level and replica count, it will give a predicted replica count that can meet the target resource level in the future. These metrics can be of any type other than
ResourceandContainerResource, but note that you must set the samenamefor these metrics as set during training. Similarly, these metrics are also only used for historical queries, so you do not need to set target values.
Then let’s look at the algorithm parameters. Here is a brief explanation of the functions of a few key parameters. More information can be referred to the flags description of the algorithm script itself:
--re-history-len: This parameter specifies the historical length of the replica recommendation algorithm learning, it is generally recommended to cover at least two behavioral cycles of the application.--re-time-delta-hours: This parameter specifies the UTC offset value of the time zone where the application is located, the replica number recommendation algorithm needs to sense the time zone information to learn the time features.--re-test-dataset-size-in-seconds: This parameter specifies the test set size of the replica recommendation algorithm learning, default is one day (86400), only when the historical length is less than one day do you need to shorten it, such as setting it as one hour (3600) in this example.--scaling-freq: This parameter specifies the accuracy of the final replica number prediction result of the algorithm, that is, the maximum frequency of actual scaling, so it cannot be shorter than the original prediction accuracy of the timeseries forecasting algorithm (thefreqparameter used in timeseries forecasting model training). The algorithm will resample the original prediction result by the maximum value according to the given accuracy and output it. For example, if this parameter is set to 1 hour, the algorithm will finally give the maximum number of replicas needed by this workload every hour, and finally this workload will scale up and down at most once an hour.
Execute the following command to create this IHPA:
kubectl apply -f dynamic-predictive-portrait-sample.yaml
Verify results
- Verify that IHPA automatically created a CronJob to run the algorithm task, and the last task ran successfully:
kubectl get cj -n kapacity-system
NAME                                   SCHEDULE       SUSPEND   ACTIVE   LAST SCHEDULE   AGE
default-predictive-sample-predictive   0/30 * * * *   False     1        26m             2d1h
kubectl get job -n kapacity-system
NAME                                            COMPLETIONS   DURATION   AGE
default-predictive-sample-predictive-28286564   1/1           16s        28m
- Verify that the algorithm result was successfully written to the predictive horizontal portrait of IHPA:
kubectl get hp predictive-sample-predictive -o yaml
apiVersion: autoscaling.kapacitystack.io/v1alpha1
kind: HorizontalPortrait
metadata:
  name: predictive-sample-predictive
  namespace: default
  ...
spec:
  ...
status:
  conditions:
  - lastTransitionTime: "2023-10-25T11:00:00Z"
    message: portrait has been successfully generated
    observedGeneration: 1
    reason: SucceededGeneratePortrait
    status: "True"
    type: PortraitGenerated
  portraitData:
    expireTime: "2023-10-25T11:30:00Z"
    timeSeries:
      timeSeries:
      - replicas: 4
        timestamp: 1698231600
      - replicas: 3
        timestamp: 1698232200
      - replicas: 2
        timestamp: 1698232800
    type: TimeSeries
- Verify that IHPA has adjusted the replica count of the workload according to the prediction result of the algorithm:
kubectl describe ihpa predictive-sample
...
Events:
  Type     Reason                Age                 From             Message
  ----     ------                ----                ----             -------
  Warning  NoValidPortraitValue  29m (x10 over 85m)  ihpa_controller  no valid portrait value for now
  Normal   UpdateReplicaProfile  25m                 ihpa_controller  update ReplicaProfile with onlineReplcas: 1 -> 4, cutoffReplicas: 0 -> 0, standbyReplicas: 0 -> 0
  Normal   UpdateReplicaProfile  15m                 ihpa_controller  update ReplicaProfile with onlineReplcas: 4 -> 3, cutoffReplicas: 0 -> 0, standbyReplicas: 0 -> 0
  Normal   UpdateReplicaProfile  5m9s                ihpa_controller  update ReplicaProfile with onlineReplcas: 3 -> 2, cutoffReplicas: 0 -> 0, standbyReplicas: 0 -> 0
Cleanup
Run following command to cleanup all the resources:
kubectl delete -f dynamic-predictive-portrait-sample.yaml
kubectl delete -f periodic-client.yaml
kubectl delete -f nginx-ingress.yaml
kubectl delete -f nginx-statefulset.yaml
2.2.1.4 - Multi-Stage Gray Scaling
Before you begin
You need to have a Kubernetes cluster with Kapacity installed.
Run sample workload
Download nginx-statefulset.yaml and run following command to run an NGINX workload:
kubectl apply -f nginx-statefulset.yaml
Check if the workload is running:
kubectl get po
NAME      READY   STATUS    RESTARTS   AGE
nginx-0   1/1     Running   0          5s
Create IHPA with gray scale down strategy
Download gray-strategy-sample.yaml which looks like this:
apiVersion: autoscaling.kapacitystack.io/v1alpha1
kind: IntelligentHorizontalPodAutoscaler
metadata:
  name: gray-strategy-sample
spec:
  scaleTargetRef:
    apiVersion: apps/v1
    kind: StatefulSet
    name: nginx
  minReplicas: 1
  maxReplicas: 10
  portraitProviders:
  - priority: 1
    static:
      replicas: 1
    type: Static
  - cron:
      crons:
      - name: cron-1
        replicas: 5
        start: 0 * * * *
        end: 10 * * * *
    priority: 2
    type: Cron
  behavior:
    scaleDown:
      grayStrategy:
        grayState: Cutoff         # GrayState is the desired state of pods that in gray stage.
        changeIntervalSeconds: 30 # ChangeIntervalSeconds is the interval time between each gray change.
        changePercent: 50         # ChangePercent is the percentage of the total change of replica numbers which is used to calculate the amount of pods to change in each gray change.
        observationSeconds: 60    # ObservationSeconds is the additional observation time after the gray change reaching 100%.
This IHPA contains below two portrait providers:
- A static portrait provider with priority 1 and a static replica number 1.
- A cron portrait provider with priority 2 and replica number 5 which takes effect the 0th minute to the 10th minute of every hour.
Note that the cron portrait provider’s priority is higher than the static one, so the replica number it provided would override the one provided by the static portrait provider when it is effective.
Run following command to create the IHPA:
kubectl apply -f gray-strategy-sample.yaml
Verify results
We can see that the cron portrait provider is taking effect at 0~10th minute of every hour, and the replicas of the workload are scaled up from 1 to 5:
kubectl get po -L 'kapacitystack.io/pod-state' -o wide
NAME      READY   STATUS    RESTARTS   AGE   IP          NODE             NOMINATED NODE   READINESS GATES   POD-STATE
nginx-0   1/1     Running   0          50m   10.1.5.52   docker-desktop   <none>           1/1
nginx-1   1/1     Running   0          56s   10.1.5.68   docker-desktop   <none>           1/1
nginx-2   1/1     Running   0          54s   10.1.5.69   docker-desktop   <none>           1/1
nginx-3   1/1     Running   0          52s   10.1.5.70   docker-desktop   <none>           1/1
nginx-4   1/1     Running   0          50s   10.1.5.71   docker-desktop   <none>           1/1
The number of endpoints of the service of the workload is also changed to 5:
kubectl get ep nginx
NAME    ENDPOINTS                                            AGE
nginx   10.1.5.52:80,10.1.5.68:80,10.1.5.69:80 + 2 more...   3d3h
At the 10th minute, we can see that 2 pods change to Cutoff state and are removed from the endpoints of the service:
kubectl get po -L 'kapacitystack.io/pod-state' -o wide
NAME      READY   STATUS    RESTARTS   AGE   IP          NODE             NOMINATED NODE   READINESS GATES   POD-STATE
nginx-0   1/1     Running   0          51m   10.1.5.52   docker-desktop   <none>           1/1
nginx-1   1/1     Running   0          63s   10.1.5.68   docker-desktop   <none>           1/1
nginx-2   1/1     Running   0          61s   10.1.5.69   docker-desktop   <none>           1/1
nginx-3   1/1     Running   0          59s   10.1.5.70   docker-desktop   <none>           0/1               Cutoff
nginx-4   1/1     Running   0          57s   10.1.5.71   docker-desktop   <none>           0/1               Cutoff
kubectl get ep nginx
NAME    ENDPOINTS                                AGE
nginx   10.1.5.52:80,10.1.5.68:80,10.1.5.69:80   3d3h
After waiting for another 30 seconds, we can see that the 4 pods change to Cutoff state and are removed from the endpoints of the service:
kubectl get po -L 'kapacitystack.io/pod-state' -o wide
NAME      READY   STATUS    RESTARTS   AGE   IP          NODE             NOMINATED NODE   READINESS GATES   POD-STATE
nginx-0   1/1     Running   0          51m   10.1.5.52   docker-desktop   <none>           1/1
nginx-1   1/1     Running   0          96s   10.1.5.68   docker-desktop   <none>           0/1               Cutoff
nginx-2   1/1     Running   0          94s   10.1.5.69   docker-desktop   <none>           0/1               Cutoff
nginx-3   1/1     Running   0          92s   10.1.5.70   docker-desktop   <none>           0/1               Cutoff
nginx-4   1/1     Running   0          90s   10.1.5.71   docker-desktop   <none>           0/1               Cutoff
kubectl get ep nginx
NAME    ENDPOINTS      AGE
nginx   10.1.5.52:80   3d3h
After waiting for another 1 minute, we can see that the replicas of the workload are finally scaled down to 1:
kubectl get po -L 'kapacitystack.io/pod-state' -o wide
NAME      READY   STATUS    RESTARTS   AGE    IP          NODE             NOMINATED NODE   READINESS GATES   POD-STATE
nginx-0   1/1     Running   0          52m    10.1.5.52   docker-desktop   <none>           1/1
You can also see the entire process of scaling by checking events of the IHPA:
kubectl describe ihpa gray-strategy-sample
...
Events:
  Type    Reason                Age    From             Message
  ----    ------                ----   ----             -------
  Normal  CreateReplicaProfile  3m53s  ihpa_controller  create ReplicaProfile with onlineReplcas: 1, cutoffReplicas: 0, standbyReplicas: 0
  Normal  UpdateReplicaProfile  2m44s  ihpa_controller  update ReplicaProfile with onlineReplcas: 1 -> 5, cutoffReplicas: 0 -> 0, standbyReplicas: 0 -> 0
  Normal  UpdateReplicaProfile  104s   ihpa_controller  update ReplicaProfile with onlineReplcas: 5 -> 3, cutoffReplicas: 0 -> 2, standbyReplicas: 0 -> 0
  Normal  UpdateReplicaProfile  74s    ihpa_controller  update ReplicaProfile with onlineReplcas: 3 -> 1, cutoffReplicas: 2 -> 4, standbyReplicas: 0 -> 0
  Normal  UpdateReplicaProfile  14s    ihpa_controller  update ReplicaProfile with onlineReplcas: 1 -> 1, cutoffReplicas: 4 -> 0, standbyReplicas: 0 -> 0
Cleanup
Run following command to cleanup all the resources:
kubectl delete -f gray-strategy-sample.yaml
kubectl delete -f nginx-statefulset.yaml
3 - User Guide
3.1 - IHPA (Intelligent HPA)
This section contains IHPA’s core concepts and some detailed usages.
If you have no idea of what IHPA is, read the introduction.
If you want to get started to utilize IHPA’s core features quickly, follow the quick start guide.
3.1.1 - Concepts
3.1.1.1 - IHPA Architecture Overview
Note: Most contents of this page are translated by AI from Chinese. It would be very appreciated if you could help us improve by editing this page (click the corresponding link on the right side).
Component Architecture
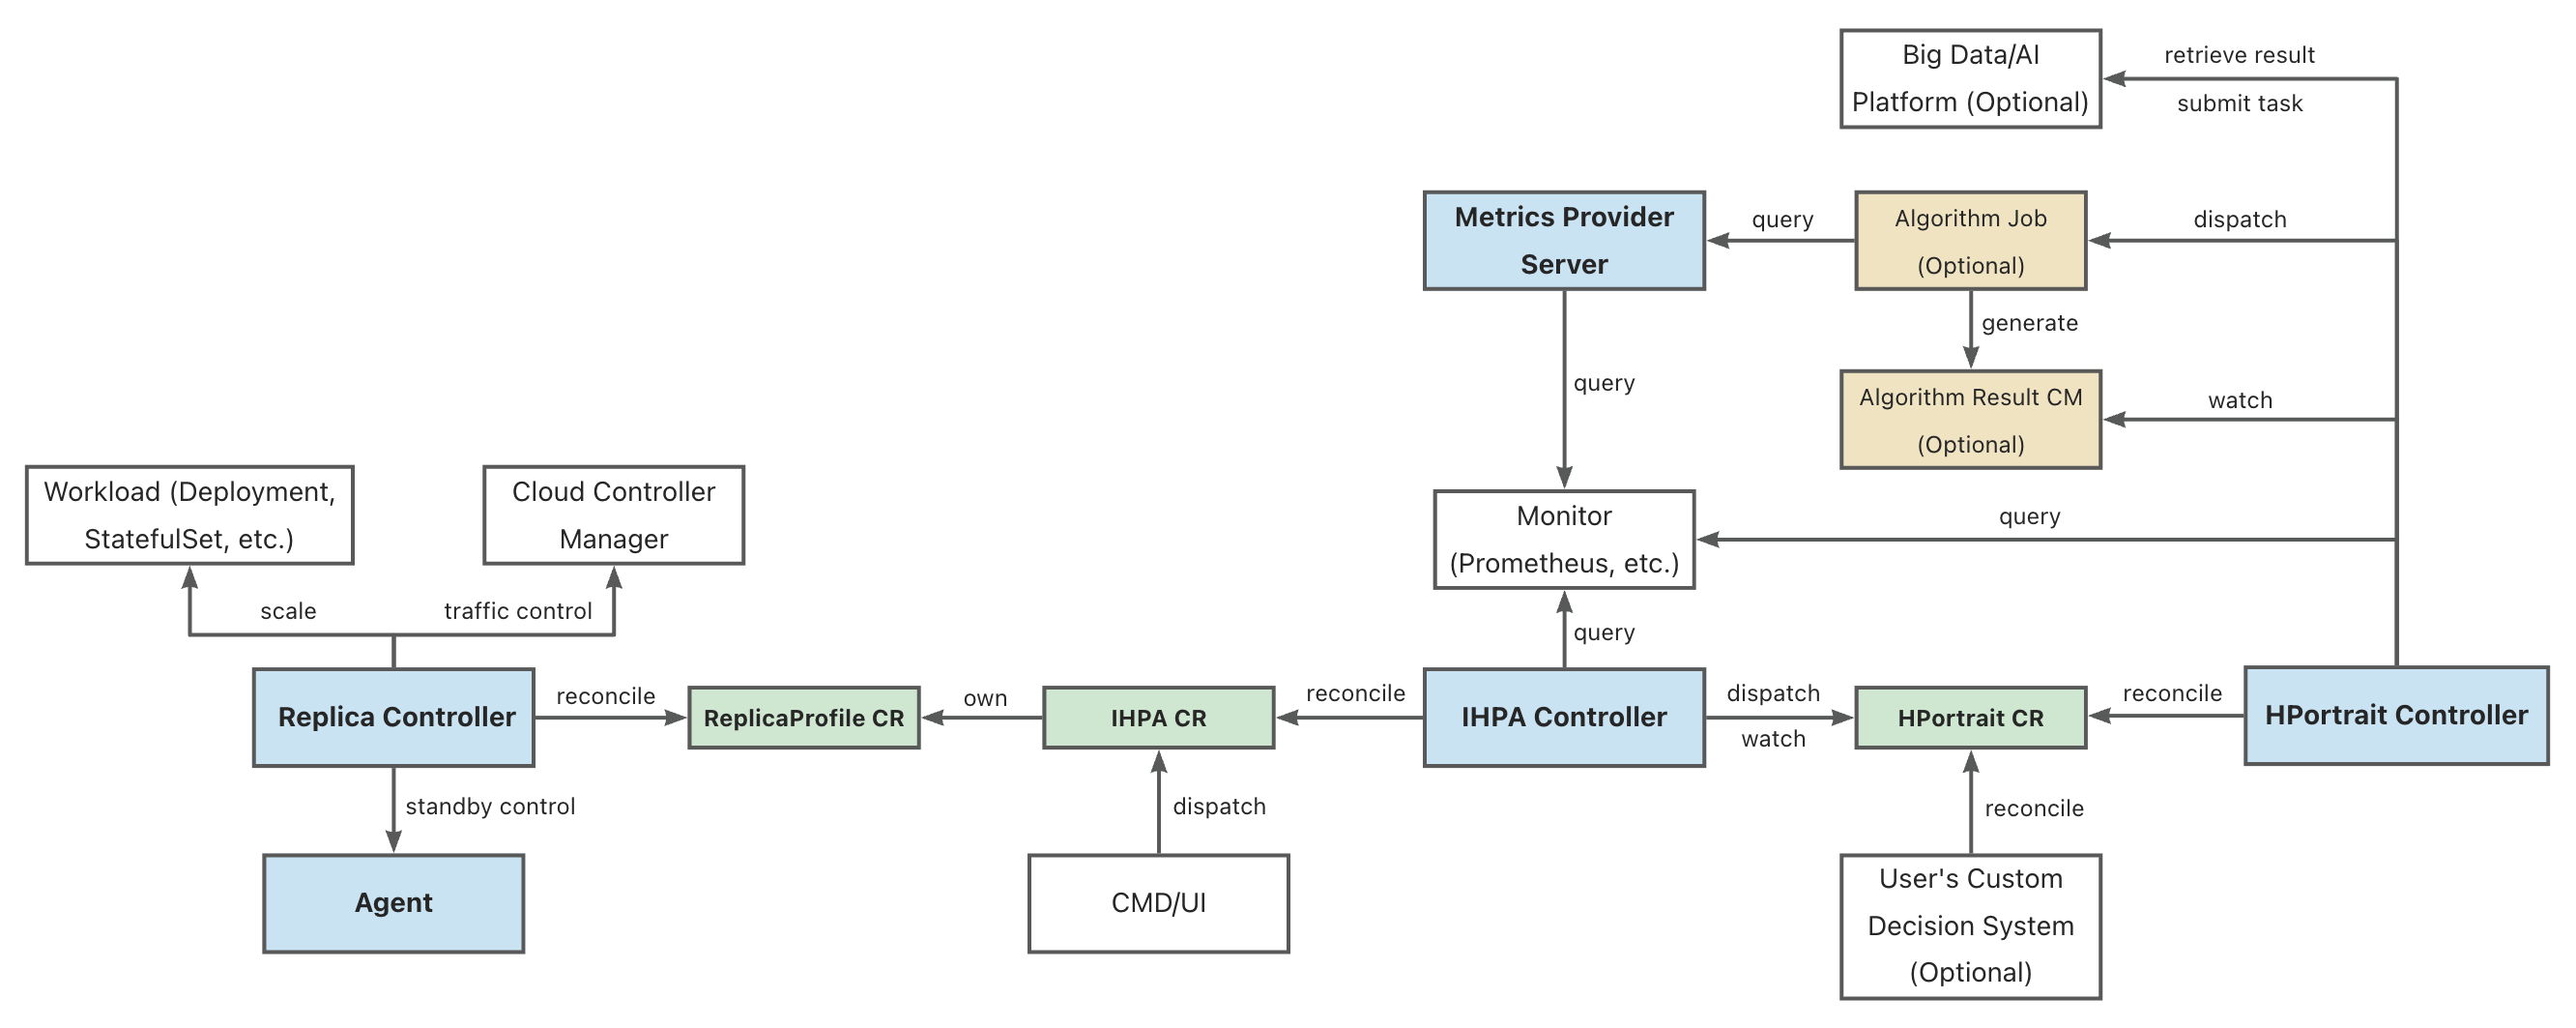
Legend:
- Components of IHPA itself are in blue background
- Kubernetes CRs of IHPA are in green background
- Other Kubernetes resources that IHPA depends on are in yellow background
- Related external systems of IHPA are in white background
Full name of some abbreviations:
- IHPA: IntelligentHorizontalPodAutoscaler
- HPortrait: HorizontalPortrait
- CM: ConfigMap
Component Overview
Replica Controller
Replica Controller is the IHPA execution layer component. It is responsible for the control of the specific workload replica quantity and status. It supports the operations such as scaling, traffic cutoff, and activation of Pods by docking with different native and third-party components.
IHPA Controller
IHPA Controller is the IHPA control plane component. It directly accepts IHPA configurations from users or external systems (including target workload, metrics, algorithms, change and stability configurations, etc.), issues profiling tasks and integrates profiling results, and then performs multi-level batched elasticity scaling based on the profiling results.
HPortrait Controller
HPortrait Controller is the built-in horizontal elasticity scaling algorithm management component. It is responsible for running and managing the workflows of different elasticity scaling algorithms for different workloads, and converting their output results into standard profiling format. The specific algorithm sub-tasks are scheduled to be executed as separate Kubernetes Jobs or tasks on other big data/algorithm platforms. These sub-tasks obtain historical and real-time metric data from external monitoring systems for computation and generation of profiling results.
Specifically, the logic of some simple algorithms (such as reactive algorithms, etc.) is directly implemented in this component, without going through separate algorithm sub-tasks.
Metrics Provider Server
Metrics Provider Server is the unified monitoring metrics query component. It shields the differences of the underlying monitoring system, providing a unified monitoring metrics query service for external running components (such as algorithm tasks, etc.).
The API it provides is similar to Kubernetes Metrics API, but the difference is that it supports both real-time and historical metric queries.
Agent (not included yet)
Agent is the agent component running on the nodes of the Kubernetes cluster. It is mainly responsible for executing operations that require interaction with the underlying operating system, such as activating and de-activating Pods.
3.1.1.2 - Principles of Predictive Scaling
Note: Most contents of this page are translated by AI from Chinese. It would be very appreciated if you could help us improve by editing this page (click the corresponding link on the right side).
Advantages of Predictive Scaling
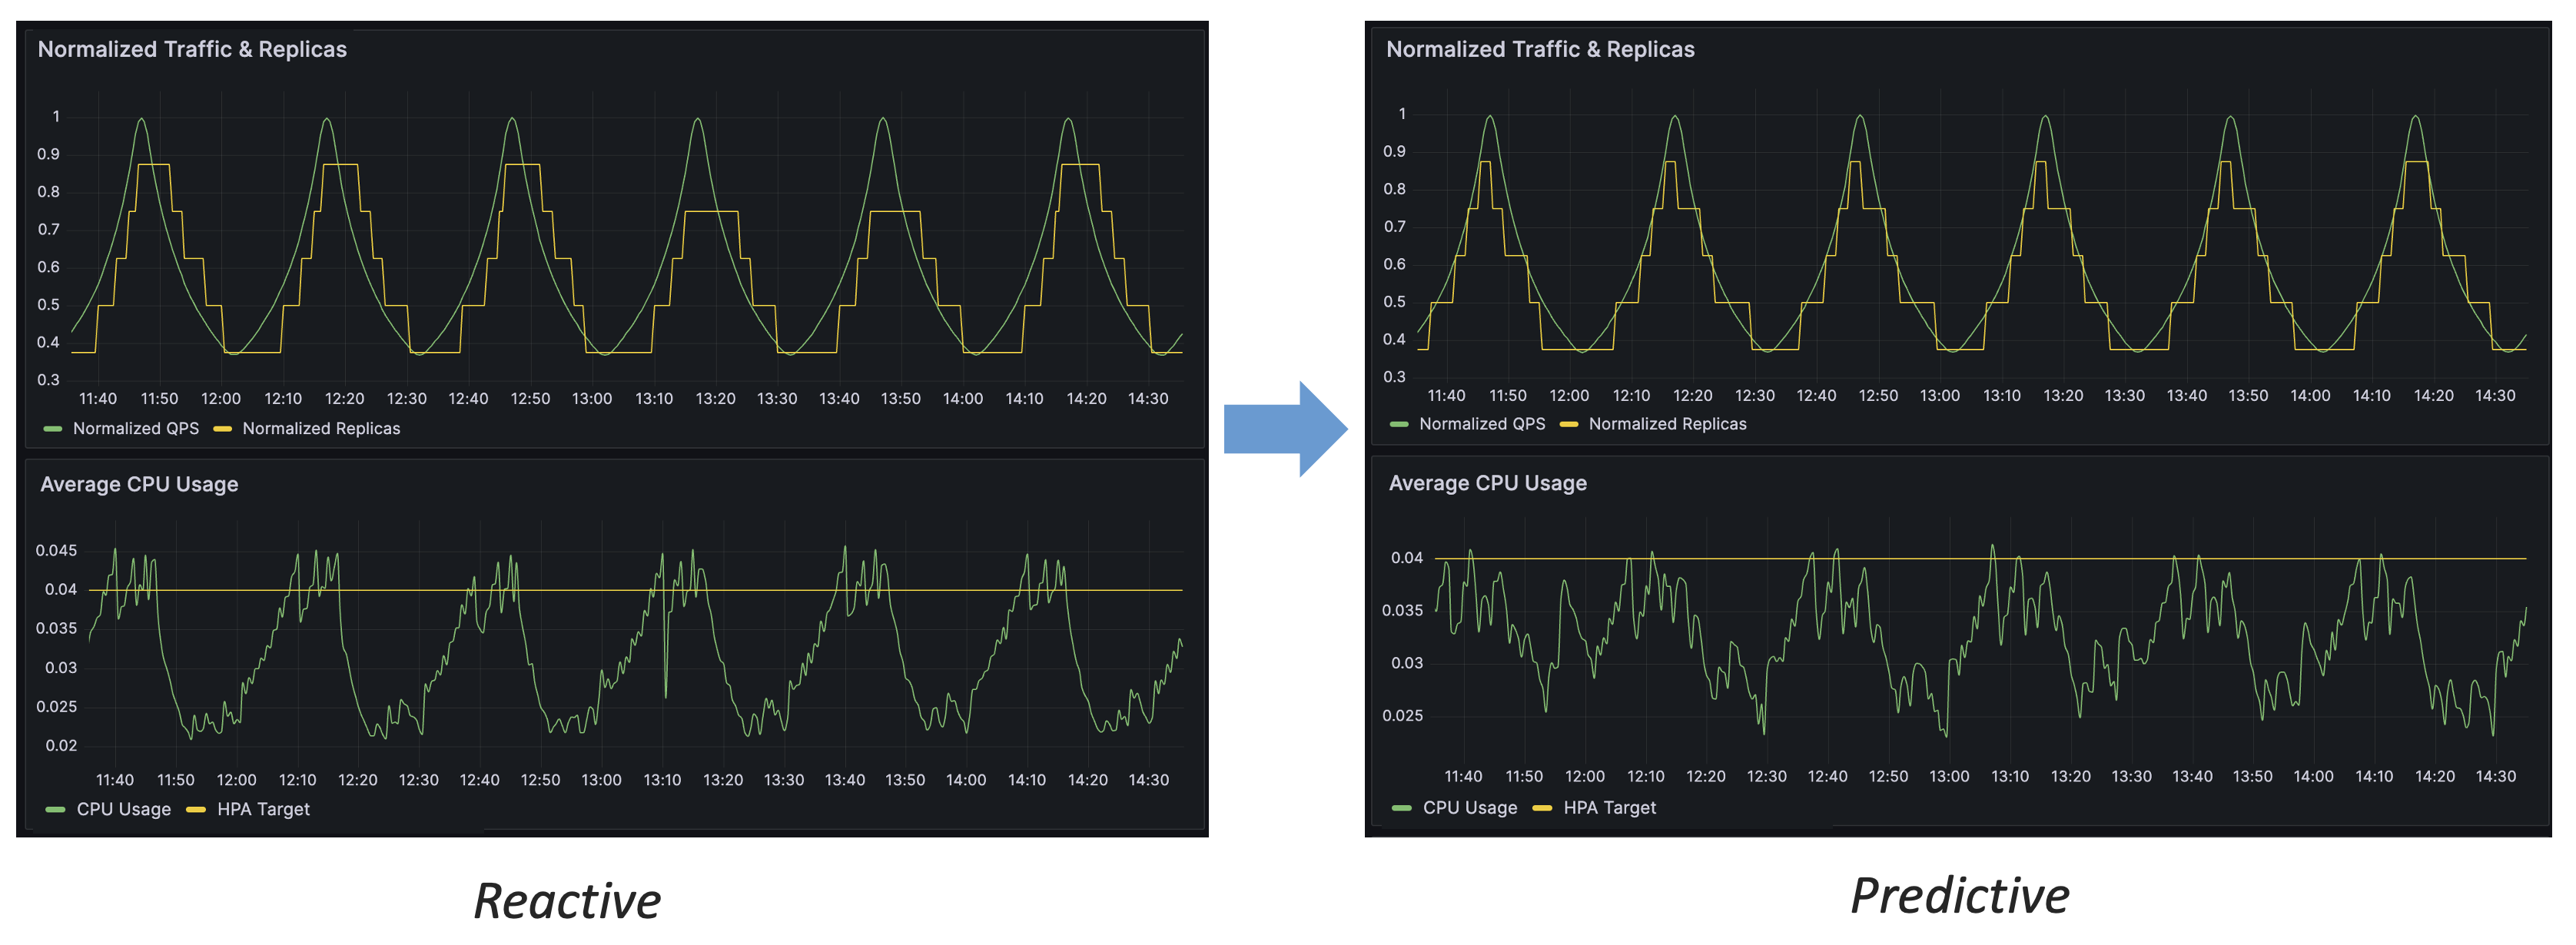
By the comparison of above figure, we can conclude several advantages of predictive scaling over reactive scaling:
- Predictive scaling can respond to traffic changes in advance
- Predictive scaling can control resource levels more stably
- Predictive scaling has higher accuracy and can use resources more effectively
Traffic-Driven Replicas Prediction
In this section, we will introduce in detail the design concept and working principle of IHPA’s “traffic-driven replicas prediction” algorithm.
Why Traffic-Driven
For online applications, capacity (resource) indicators (such as CPU utilization) are strongly correlated with traffic, i.e., traffic variations drive changes in capacity indicators. Predicting capacity through traffic, rather than directly predicting capacity indicators, has the following advantages:
- Traffic indicators are the most upstream indicators, which change before capacity indicators, and respond quickly.
- Capacity indicators are easily disturbed by a variety of factors (such as the application’s own code issues, host performance, etc.), while traffic indicators are only directly related to application characteristics (such as user usage habits), making them easier to predict over time.
Modeling the Relationship between Traffic, Capacity and Replicas
In order to convert the replica count prediction problem into a traffic prediction problem, we designed a Linear-Residual Model to find the association function between traffic, capacity, and replica count, as shown in the following figure:

In this model, we set the resource utilization rate as the target indicator, because controlling the resource level of the application is our ultimate goal of using elastic scaling, which is the most intuitive.
However, unlike the reactive scaling algorithm of Kubernetes HPA, although we set the resource utilization rate as the target indicator, this algorithm will not only consider this indicator, but will take historical traffic (supporting multiple lines), historical resource utilization, and historical replica count as inputs. These indicators will first go through a linear model, which can learn the linear association between the three, and get the association function in the above figure; then, they will go through a residual model with other information (currently only includes time information), which will correct the association function after considering other information, and can learn the complex non-linear association between traffic, capacity and replica count.
Here is a simple example to illustrate the main function of the residual model: Suppose an online application executes an internal timed task every Sunday morning, which brings additional CPU resource consumption, but it has no association with the external traffic handled by the application. At this time, this feature cannot be learned through the linear model alone. After introducing the residual model, this model can learn this feature based on time information, so at the time of Sunday morning, we give the same traffic and replica count as other times, and the function it gives will output higher CPU consumption, which is in line with the actual situation.
In the current algorithm implementation, we use ElasticNet as the linear model and LightGBM as the residual model. They are both traditional machine learning algorithms, not strongly dependent on GPU, have lower usage overhead compared to deep learning algorithms, and can also achieve good results. Of course, you can also replace the specific implementation of these models according to your own needs, and you are welcome to provide implementations that you think are superior in certain scenarios.
After using this model to get the association function, we can convert the replica count prediction problem into a traffic prediction problem: knowing the target resource utilization rate, just input the predicted traffic, and you can get the predicted replica count (which can maintain the target average resource utilization rate under the predicted traffic).
Model Details
Denote workflow information (including traffics, resource usage, replicas) as $k$, target indicator (resource usage) as $y$, and meta information (including time, etc.) as $\omega$. We first use a linear model to characterize the skeleton of target indicator: $$\hat y_l = L(x)$$ Then we calculate the error of the linear model: $$e = y - \hat y$$ Next, we combine meta information with the error of the linear model, and mature it by a residual model: $$\hat e = R(\hat y,\omega)$$ Finally, we get the estimation of $y$ as: $$\hat y_r = \hat y_l + \hat e$$ where $L$ and $R$ could be any linear and residual model.
Time Series Forecasting of Traffic
We designed a deep learning model called Swish Net for Time Series Forecasting to predict traffic indicators over time. This model is specifically optimized for the use case of IHPA and has the following two main characteristics:
- Lightweight:The model has a relatively simple structure, which results in a smaller model size and lower training cost. For example, for a single traffic prediction, predicting 12 future points from 12 historical points (which is a 2-hour long prediction at 10-minute accuracy), the trained model size is less than 1 MiB. Under PC-level CPU training, an epoch only takes about 1 minute, and training can be completed in about 1-2 hours.
- Better performance on production traffics forecasting:We compared this model with other common deep learning time series forecasting models using a production traffic dataset. The results show that this model outperforms other models in the task of production traffic time series forecasting, as shown in the following table:
| MAE | RMSE | |
|---|---|---|
| DeepAR | 1.734 | 31.315 |
| N-BEATS | 1.851 | 41.681 |
| ours | 1.597 | 28.732 |
Model Details

Assuming that the historical traffic $y_{1:T,i}$ is known, the future real traffic is $y_{T+1:T+\tau,i}$, the predicted traffic is $\hat y_{T+1:T+\tau,i}$, and the category of the traffic (such as App) is $i$. The traffic time series will have cyclical, trend, and autoregressive features. We design the following modules to capture these characteristics, and aggregate information to make predictions for the future.
-
The Embedding Layer of the model projects category information and time information into high-dimensional vectors. The category information expresses the differences between different sequences, and the time information can express the cyclicity of the time series: $$V_i = Embed(i)$$ $$V_t = Embed(t)$$
-
The cross product of the model’s time and category features with historical traffic can further extract different differential and cyclical features of different sequences: $$\tilde V_i = V_i \odot y_{1:T}$$ $$\tilde V_t = V_t \odot y_{1:T}$$
-
The difference feature between the next time step and the previous time step of the traffic time series can eliminate the trend and better express the periodicity of the time series. The trend feature is included in the original sequence: $$\tilde y_{1:T} = y_{2:T} - y_{1:T-1}$$
-
The input and network structure of the Multilayer Perception layer model are expressed as follows: $$in = concate(V_i,V_t,\tilde V_i,\tilde V_t,Embed(i),Embed(t),\tilde y_{1:T},y_{1:T})$$ $$\hat y_{T+1:T+\tau,i} = MLP(in)$$ The multilayer time network summarizes the information of the above feature modules and predicts the time series of future time steps.
-
The loss function of the model is MSE: $$loss = \sum_{i,t}(y_{i,t}-\hat y_{i,t})^2$$
Full Algorithm Workflow
Finally, we can link the above two models with the relevant data sources to get the complete workflow of the IHPA predictive autoscaling algorithm, as shown in the following diagram:
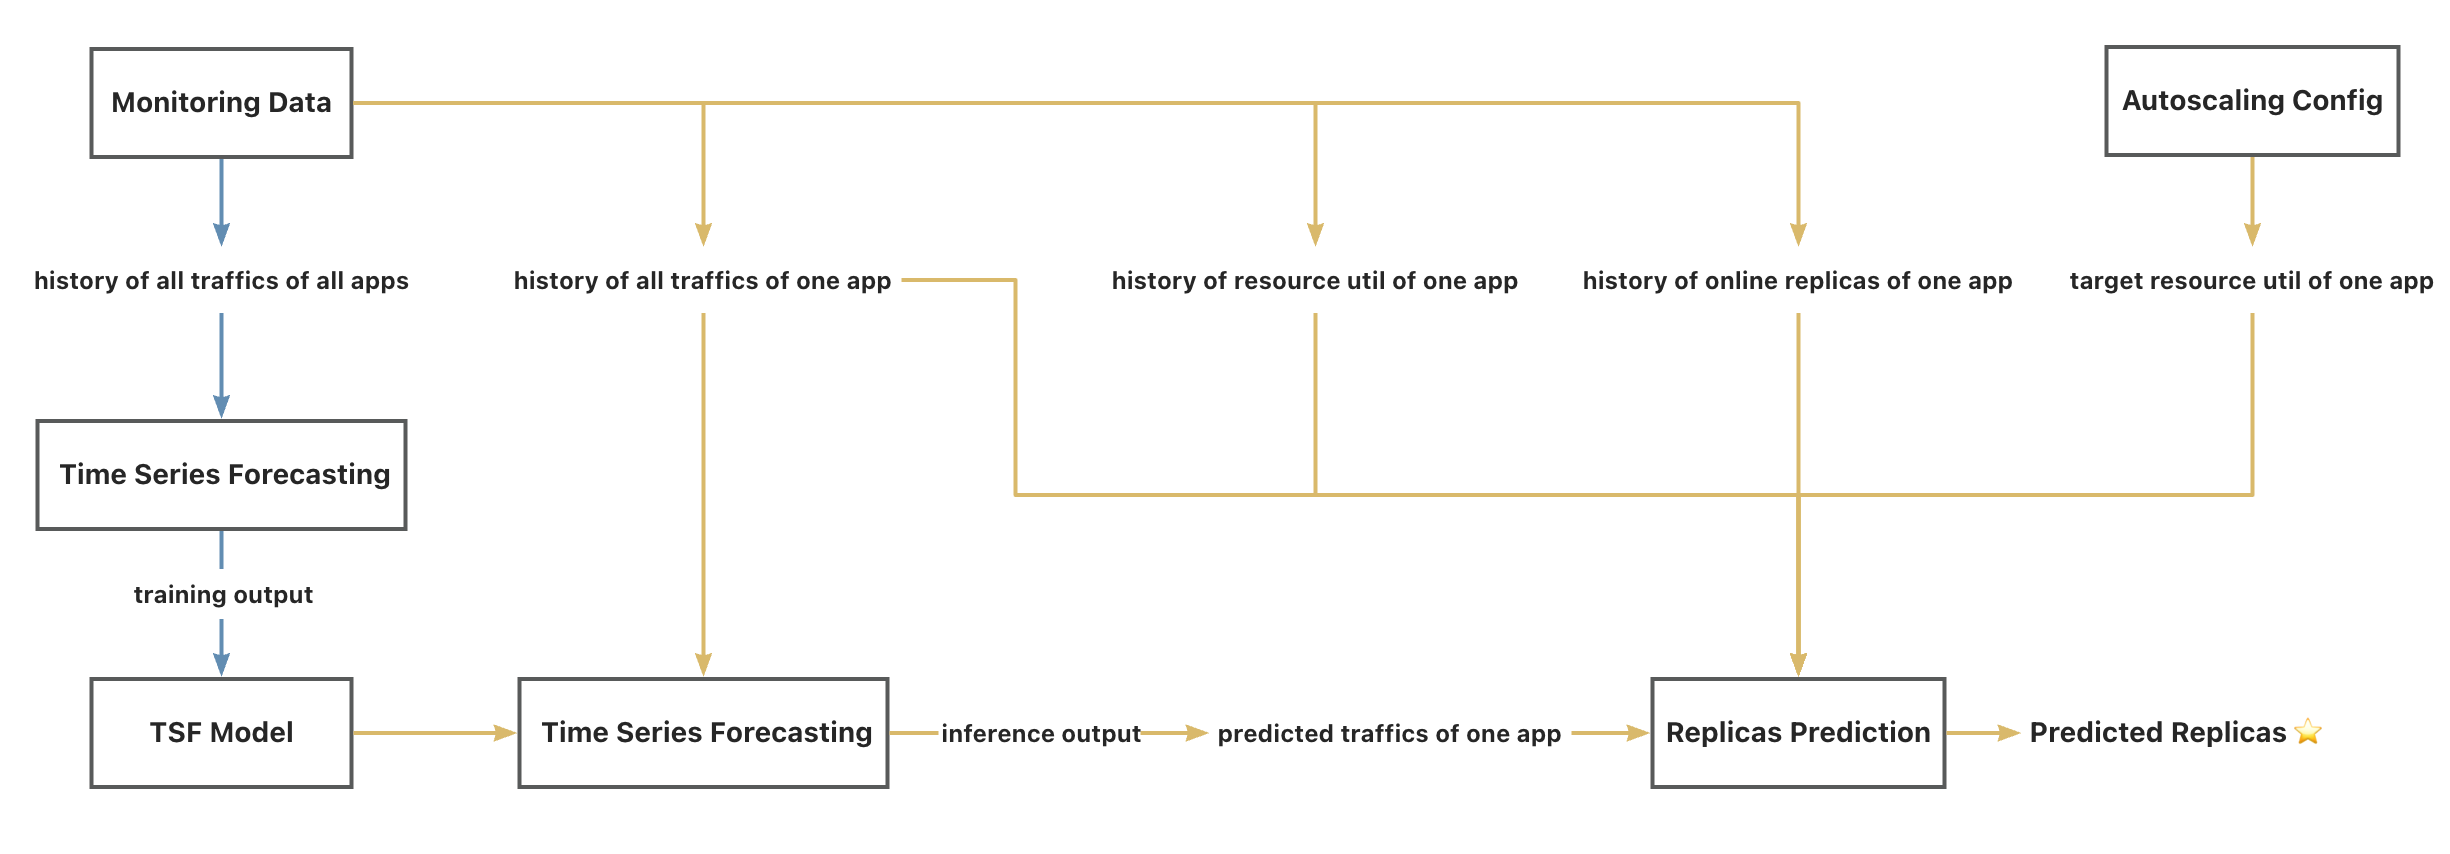
Legend:
- The blue line represents the offline workflow, which requires a large amount of data & GPU & a longer execution time, and has a lower execution frequency.
- The yellow line represents the online workflow, which requires a moderate amount of data & CPU & a shorter execution time, and has a higher execution frequency.
Note:
- The “app” here is an abstract concept, representing the smallest unit of autoscaling, typically a specific workload such as Deployment, etc.
- The “all traffics” here does not represent all monitorable traffic in the monitoring system, but represents the component traffic that is significantly positively correlated with the target resource usage indicator, which can be selected as needed according to the specific application scenario.
3.2 - Algorithm
3.2.1 - Train Time Series Forecasting Model
Note: Most contents of this page are translated by AI from Chinese. It would be very appreciated if you could help us improve by editing this page (click the corresponding link on the right side).
Before you begin
This document will guide you on how to train the time series prediction deep learning model used by Kapacity.
Before getting started, please make sure that Conda has been installed in your environment.
Install dependencies
Execute the following command to download the code of the Kapacity algorithm version you are using, install algorithm dependencies, and activate the algorithm runtime environment:
git clone --depth 1 -b algorithm-<your-kapacity-algorithm-version> https://github.com/traas-stack/kapacity.git
cd kapacity/algorithm
conda env create -f environment.yml
conda activate kapacity
Prepare configuration file
The training script will read parameters related to dataset fetching and model training from an external configuration file, so we need to prepare this configuration file in advance. You can download this example configuration file tsf-model-train-config.yaml and modify its content as needed. The content of this file is as follows:
targets:
- workloadNamespace: default
  workloadRef:
    apiVersion: apps/v1
    kind: StatefulSet
    name: nginx
  historyLength: 24H
  metrics:
  - name: qps
    type: Object
    object:
      metric:
        name: nginx_ingress_controller_requests_rate
      describedObject:
        apiVersion: networking.k8s.io/v1
        kind: Ingress
        name: nginx-server
freq: 10min
predictionLength: 3
contextLength: 7
hyperParams:
  learningRate: 0.001
  epochs: 100
  batchSize: 32
Here is an explanation of each field:
targets: List of workloads to be trained and their metric information (the algorithm supports training multiple metrics of multiple workloads in one model, but it also makes the model larger), if you wish to manually prepare the dataset instead of automatically fetching it by the algorithm, you can leave this field blank.workloadNamespace: The namespace where the workload to be trained resides.workloadRef: Reference identification of the workload object to be trained.historyLength: The length of metrics history to fetch as a dataset, supportingmin(minutes),H(hours),D(days) three time units. Generally, it is recommended to cover at least two complete cycles of periodic metrics.metrics: List of metrics to be trained for this workload, with the same format as the metrics field of IHPA. Note that you must set a differentnamefor each metric to distinguish different metrics under the same workload in the same model.
freq: The precision of the model, that is, the unit of the parameterspredictionLengthandcontextLengthbelow. The currently supported values are1min,10min,1H,1D. Note that this parameter does not affect the model size.predictionLength: The number of prediction points in the model, and the final prediction length ispredictionLength * freq. The larger this parameter is set, the larger the model will be. Generally, it is not recommended to set it too large, because the further the prediction time point, the lower the accuracy of the prediction.contextLength: The number of historical points referenced by the model during prediction (inference), and the final reference history length iscontextLength * freq. The larger this parameter is set, the larger the model will be.hyperParams: Hyperparameters of the deep learning model, generally do not need to be adjusted.
Train model
Execute the following command to train the model, note to replace the related parameters with the actual values:
python kapacity/timeseries/forecasting/train.py \
  --config-file=<your-config-file> \
  --model-save-path=<your-model-save-path> \
  --dataset-file=<your-datset-file> \
  --metrics-server-addr=<your-metrics-server-addr> \
  --dataloader-num-workers=<your-dataloader-num-workers>
Here is an explanation of each parameter:
config-file: The address of the configuration file prepared in the previous step.model-save-path: The directory address where the model is to be saved.dataset-file: The address of the dataset file prepared manually. Andmetrics-server-addrparameter choose one to fill in.metrics-server-addr: The address of the metric server for automatically fetching the dataset, that is, the address of the Kapacity gRPC service that can be accessed. Anddataset-fileparameter choose one to fill in.dataloader-num-workers: The number of subprocesses for loading the dataset, generally recommended to be set to the number of CPUs on the machine, if set to0, only the main process will be used for loading.
Tips on how to access the Kapacity gRPC service
By default, Kapacity’s gRPC service will be exposed as a ClusterIP Service, you can use the following command to view its ClusterIP and port:
kubectl get svc -n kapacity-system kapacity-grpc-service
NAME                    TYPE        CLUSTER-IP       EXTERNAL-IP   PORT(S)    AGE
kapacity-grpc-service   ClusterIP   192.168.38.172   <none>        9090/TCP   5m
If you are running the training script in the cluster, you can directly use this ClusterIP and port as metrics-server-addr.
If you are not running the training script in the cluster, you can use the following command to access this Service in the cluster from your local machine through kubectl’s port forwarding function, note to replace <local-port> with a spare port on your local machine:
kubectl port-forward -n kapacity-system svc/kapacity-grpc-service <local-port>:9090
Then, you can use localhost:<local-port> as metrics-server-addr.
After execution, you will see training logs similar to the following, please wait until the training is completed (the command exits normally):
2023-10-18 20:05:07,757 - INFO: Epoch: 1 cost time: 55.25944399833679
2023-10-18 20:05:07,774 - INFO: Epoch: 1, Steps: 6 | Train Loss: 188888896.6564227
Validation loss decreased (inf --> 188888896.656423).  Saving model ...
2023-10-18 20:05:51,157 - INFO: Epoch: 2 cost time: 43.38192820549011
2023-10-18 20:05:51,158 - INFO: Epoch: 2, Steps: 6 | Train Loss: 212027786.7585510
EarlyStopping counter: 1 out of 15
2023-10-18 20:06:30,055 - INFO: Epoch: 3 cost time: 38.89493203163147
2023-10-18 20:06:30,060 - INFO: Epoch: 3, Steps: 6 | Train Loss: 226666666.7703293
After the training is completed, you can see the trained model and its associated files in the model-save-path directory:
-rw-r--r-- 1 admin  staff   316K Oct 18 20:18 checkpoint.pth
-rw-r--r-- 1 admin  staff   287B Oct 18 20:04 estimator_config.yaml
-rw-r--r-- 1 admin  staff    29B Oct 18 20:04 item2id.json
3.3 - Use Custom Metrics
Note: Most contents of this page are translated by AI from Chinese. It would be very appreciated if you could help us improve by editing this page (click the corresponding link on the right side).
Background
The Kubernetes Metrics API provides a set of common metric query interfaces within the K8s system, but it only supports querying the current real-time value of metrics, doesn’t support querying historical values, and also doesn’t support aggregated querying of Pod metrics based on the workload dimension, which cannot meet the data needs of various intelligent algorithms. Therefore, Kapacity has further abstracted and extended the Metrics API, supporting general metric history query and workload dimension aggregation query and other advanced query capabilities while being maximally compatible with user usage habits.
Currently, the Metrics API provided by Kapacity supports the following two metric provider backends:
Use Prometheus as metric provider (default)
Set the startup parameter --metric-provider of Kapacity Manager to prometheus to use Prometheus as metric provider.
If you use this provider, you only need a Prometheus, no need to install Kubernetes Metrics Server or other Metrics Adapters (including Prometheus Adapter).
You can find the prometheus-metrics-config.yaml configuration in the ConfigMap kapacity-config in the namespace where Kapacity Manager is located. By modifying this configuration, you can fully customize Prometheus query statements for different metric types. The format of this configuration is fully compatible with the configuration of Prometheus Adapter, so if you have previously configured custom HPA metrics with Prometheus Adapter, you can directly reuse the previous configuration.
The default configuration provided by Kapacity is as follows:
resourceRules:
  cpu:
    containerQuery: |-
      sum by (<<.GroupBy>>) (
        irate(container_cpu_usage_seconds_total{container!="",container!="POD",<<.LabelMatchers>>}[3m])
      )
    readyPodsOnlyContainerQuery: |-
      sum by (<<.GroupBy>>) (
          (kube_pod_status_ready{condition="true"} == 1)
        * on (namespace, pod) group_left ()
          sum by (namespace, pod) (
            irate(container_cpu_usage_seconds_total{container!="",container!="POD",<<.LabelMatchers>>}[3m])
          )
      )
    resources:
      overrides:
        namespace:
          resource: namespace
        pod:
          resource: pod
    containerLabel: container
  memory:
    containerQuery: |-
      sum by (<<.GroupBy>>) (
        container_memory_working_set_bytes{container!="",container!="POD",<<.LabelMatchers>>}
      )
    readyPodsOnlyContainerQuery: |-
      sum by (<<.GroupBy>>) (
          (kube_pod_status_ready{condition="true"} == 1)
        * on (namespace, pod) group_left ()
          sum by (namespace, pod) (
            container_memory_working_set_bytes{container!="",container!="POD",<<.LabelMatchers>>}
          )
      )
    resources:
      overrides:
        namespace:
          resource: namespace
        pod:
          resource: pod
    containerLabel: container
  window: 3m
rules: []
externalRules:
- seriesQuery: '{__name__="kube_pod_status_ready"}'
  metricsQuery: sum(<<.Series>>{condition="true",<<.LabelMatchers>>})
  name:
    as: ready_pods_count
  resources:
    overrides:
      namespace:
        resource: namespace
workloadPodNamePatterns:
- group: apps
  kind: ReplicaSet
  pattern: ^%s-[a-z0-9]+$
- group: apps
  kind: Deployment
  pattern: ^%s-[a-z0-9]+-[a-z0-9]+$
- group: apps
  kind: StatefulSet
  pattern: ^%s-[0-9]+$
To support advanced query capabilities such as workload dimension aggregation query, we have extended some fields on top of the Prometheus Adapter configuration, and below is a brief explanation of these extended fields:
workloadPodNamePatterns: Some algorithms of Kapacity will need to query workload dimension metric information, such as the total CPU usage of a workload’s Pods, the number of Ready Pods of a workload, etc. At this time, Kapacity will aggregate queries on Pod dimension metrics by matching the workload Pod name with regular expressions, so it is necessary to configure the regular matching rules of Pod names for different types of workloads through this field. If you use workloads other than the default configuration, you need to add the corresponding configuration in this field.readyPodsOnlyContainerQuery: Some algorithms of Kapacity have extra conditions when querying the total resource usage of workload Pods, such as only querying the total CPU usage of some workload’s Ready Pods. In this case, we need to provide a separate PQL statement through this field for this special condition query. Kapacity default provides a query statement based on the metrics provided by kube-state-metrics, you can also modify it to other implementations as needed.
Use Kubernetes Metrics API as metric provider (not recommended)
Set the startup parameter --metric-provider of Kapacity Manager to metrics-api to use Kubernetes Metrics API as metric provider.
If you use this provider, you need to install Kubernetes Metrics Server or other Metrics Adapters (such as Prometheus Adapter) to shield the differences of the underlying monitoring system.
However, it should be noted that this backend does not support the query of historical values of metrics, nor does it support the aggregation query of Pod metrics based on the workload dimension, so its usable range is very limited, only suitable for some scenarios that only use simple algorithms, such as Reactive Scaling.
3.4 - FAQ
Note: Most contents of this page are translated by AI from Chinese. It would be very appreciated if you could help us improve by editing this page (click the corresponding link on the right side).
IHPA
Predictive algorithm job failed with error replicas estimation failed
The error is due to the failure of the “Traffic, Capacity and Replicas Relationship Modeling” algorithm to produce a usable model, the following methods can be attempted to solve this issue:
- Try increasing the length of historical data by adjusting the algorithm job parameter
--re-history-len. - With the detailed model evaluation information returned with the error, try relaxing the model validation requirements by adjusting the algorithm job parameters
--re-min-correlation-allowedand--re-max-mse-allowed. However, be aware that if the relaxed values differ too much from the default values, the accuracy of the model may be hard to guarantee.
4 - Contributing
Welcome to Kapacity!
Thank you so much for helping Kapacity become better.
Please note that contributing code is not the only way of contributing, there are many other forms of contributions that are also welcomed, such as:
- Answering questions in GitHub Discussions
- Submitting bug report or feature request in GitHub Issues
- Reviewing others code in GitHub Pull Requests
- Contributing to documentations
Here’s the guideline for some contribution ways.
Submitting issues
Before submitting an issue, please check whether there has been similar existing issues and avoid duplicating them.
If you want to report a security vulnerability, make sure to choose the “Report a security vulnerability” option in “New issue”. Do not submit it as a normal public issue.
Contributing code
For code related contributions, please read the developer guide to get started.
4.1 - Developer Guide
5 - Roadmap
2023
- Support intelligent machine learning replicas prediction algorithm.
- Support algorithm which detects abnormal traffic or potential capacity risks, and suggests a safe replica count proactively.
- Support custom portrait verification which further controls the rules of the algorithm output to mitigates risks.
- Support automatic risk detection and mitigation during autoscaling.
Future
- Fully support IHPA extension framework which enable users to custom or extend the behaviors/functions of IHPA without hacking into the project.
- Introduce Kapacity Agent, which supports Pod Standby state switching, Pod health scoring, etc. This can further enhance the capability of multi-stage scaling, and also serve as a basic function of colocation.
- Introduce Kapacity Scheduler, which supports dynamic scheduling based on realtime Pod and Node resource usage to improve resource utilization as well as mitigate hotspot problems, and supports more advanced scheduling strategies.
- Support on-demand batch switching of Pod Online and Standby states to support time-sharing scheduling.
- Support recommendation of Pod resource specifications (CPU, memory, etc.) through intelligent algorithms, and support dynamic adjustment of Pod resource specifications through VPA.
- Introduce console UI, and support multi-dimensional cost and carbon emission calculation.